I’ve had a fun week. What started off as a bit of a side project exploded into a big thing and I learned a bunch of stuff. So here’s a blog.
What is Aggregation
Taking a bunch of smaller stuff and putting into bigger chunks.
Like what
So imagine you want to track visits to your website. You store each visit in a database, with page, time etc. So now you want to show visits to a page in a certain week. That’s pretty easy if you have a moderate amount of hits.
But what if you have a million hits a day? Storing all that information in a database is going to be a bit of a nightmare. Particularly when you consider you’re never particularly interested in the data being that granular (ie, you don’t care who visited between 10:04:04 and 10:04:06 on a certain day).
Big woop, so what do you do
You aggregate it. Break it into chunks that you might possibly be interested in. You probably don’t care about hits in a second, or hits in a minute, but hits in an hour, day, month, year? Yeah – probably.
So even if you think of the most granular of those blocks, hours. You’re going to be storing 24 hours for each day, 356 a year. So like 9,000 database entries for a years worth of hours. That’s pretty sweet.
Big Data
I originally started storing hits in a database. It became obvious that while this was working for the couple of days of experimenting I was doing, it wasn’t going to be feasible to store that shit indefinitely.
I could have wiped old entries on a cycle. That would have kept things nice and clean. But I don’t really like destroying data like that. I want to be able to change stuff and re-aggregate the whole history if I want to.
So I settled on using Azure blob storage. Appending to a file for each minute. This is basically like writing to a file, but any of our servers can do it into a central location instead of a local disk.
Input
So the input is to basically get some data (page name, date, country of origin etc) then write it to a file named “/pageview/{year}/{month}/{day}/{hour}/{minute}.txt”.
This makes things nice a scale-able, stops files getting too big while making them accessible in a logical way.
Processing
So every hour or so a webjob runs that grabs every in “/pageview/{year}/{month}/{day}/{hour-1}/{0-60}.txt”, deserializes all of the entries and sticks them in a List.
Then with all that raw data, for this hour we can work out simple things like total user count and total page views.
agg.TotalViews = data.Count();
agg.TotalUsers = data.GroupBy( x => x.Uid ).Count();
Then we can create Facets.
agg.Facets["Browser"] = data.FacetBy( x => x.Browser.ToString(), 50 );
agg.Facets["Os"] = data.FacetBy( x => x.Os.ToString(), 50 );
agg.Facets["Pages"] = data.FacetBy( x => $"{x.Url}", 50 );
What are facets? They’re basically the top x of each entry. My FacetBy function is pretty specific to this task, but looks like this.
    public static Dictionary FacetBy( this IEnumerable seq, Func map, int TopCount = 10000 )
    {
        return seq.GroupBy( map )
                     .Where( x => !string.IsNullOrEmpty( x.Key ) )
                     .ToDictionary( x => x.Key, x => (long)x.Count() )
                    .OrderByDescending( x => x.Value )
                    .Take( TopCount )
                    .ToDictionary( x => x.Key, x => x.Value );
    }
So then we end up with something like this
{
  "Updated": "2017-06-05T21:36:51.7460534Z",
  "StartTime": "2017-06-02T18:00:00Z",
  "EndTime": "2017-06-02T19:00:00Z",
  "Period": "Hour",
  "TotalViews": 2601,
  "TotalUsers": 1128,
  "Facets": {
    "Country": {
      "United States": 263,
      "Russia": 95,
      "United Kingdom": 78,
      "Germany": 58,
      "France": 54,
      "Canada": 51,
      "Poland": 51,
      "Sweden": 44,
    },
    "City": {
      "Moscow": 20,
      "Istanbul": 10,
      "Vienna": 7,
      "Saint Petersburg": 5,
      "Prague": 5,
      "Frankfurt am Main": 4,
      "Toronto": 4,
      "Barcelona": 4,
      "Johannesburg": 4,
    },
    "Browser": {
      "Chrome": 2147,
      "Firefox": 309,
      "Safari": 125,
      "Other": 18,
      "IE": 2
    },
    "Os": {
      "Windows64": 2070,
      "Phone": 220,
      "ApplePhone": 116,
      "Osx": 74,
      "Windows32": 67,
      "Linux": 30,
      "AppleTablet": 12,
    },
    "RefererHost": {
      "(google)": 345,
      "(twitter)": 149,
      "(yandex)": 22,
      "(facebook)": 20,
      "www.rustafied.com": 15,
      "(vk)": 15,
      "mydailylikes.com": 11,
      "chiphell.com": 8,
    },
    "Pages": {
      "rust.facepunch.com/blog/devblog-162": 715,
      "rust.facepunch.com/blog": 571,
      "rust.facepunch.com/": 378,
      "rust.facepunch.com/home": 373,
      "rust.facepunch.com/changes": 132,
      "rust.facepunch.com/presskit": 74,
      "rust.facepunch.com/blog/devblog-161": 58,
      "rust.facepunch.com/commits": 55,
    }
  },
}
Day, Month, Year
Now to generate Day, Month and Year we don’t need to touch the raw data files. That’d be dumb, we already got the data from them that we need.
So instead, for the day we grab the 24 aggregated hours from the database, and aggregate them together. For the Month, we grab the days and aggregate those together. For the year, we aggregate the Month.
If you planned this out properly you don’t need different tables for each period (and nosql is perfect for this stuff).
Buckets
So what if you want to see the views of a certain page in a certain period? You bucket that shit up.
        foreach ( var grouping in data.GroupBy( x => x.Url ) )
        {
            CreateSlice( $"Page:{grouping.Key}", grouping.ToArray() );
        };
So you basically do the whole process, but you do it for each url. So you end up with entries for each page view.
End result
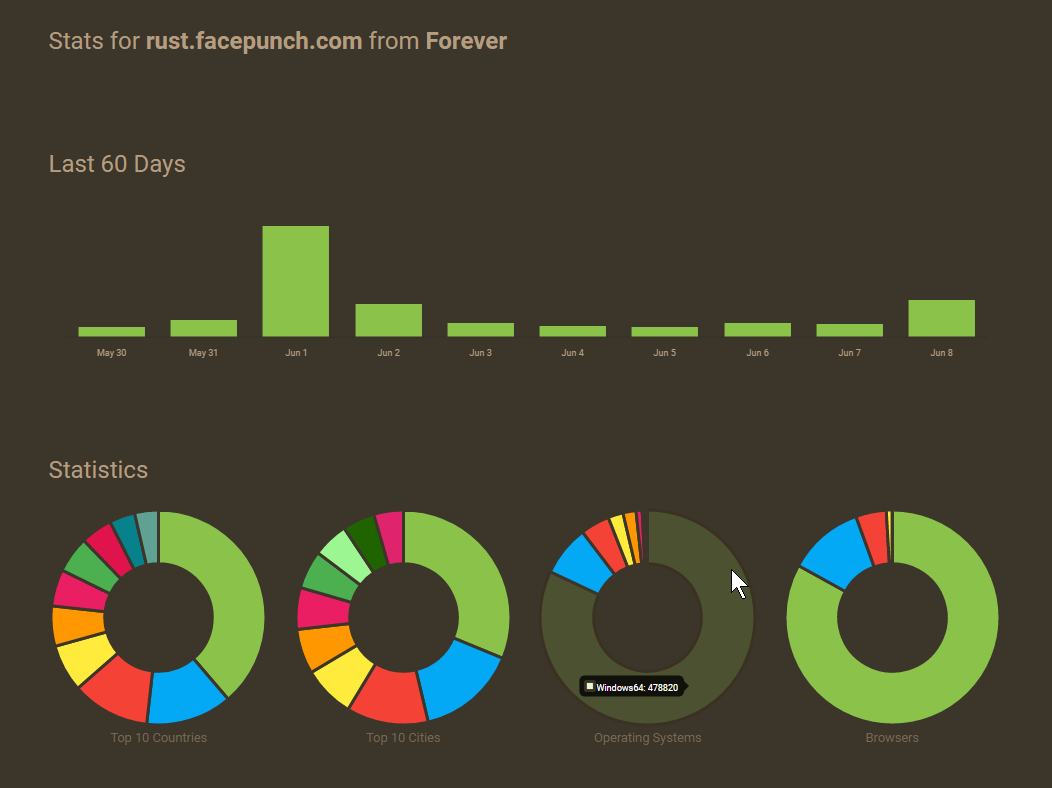
The end result is that in one database query you can show all the information you need, for any page, for any period in time, super super fast.

Like Google Analytics or something.
Use Google Analytics
The obvious answer is.. why do all this shit when Google Analytics does the same thing. And you are 100{0d2ea9d8d397d6ae549d7a28eabdef52cc52010845161897a8736269cd0593be} correct. Don’t do this unless you’re a nerd.
I wanted to make our own analytics service for our games. We were using Google Analytics for Rust but there’s a 10 million hit a month limit, and we’re at 120 million hits, so we’re losing data.
But not only that.. this kind of data manipulation is something that really interests me. Being able to take this scale of information, organise it and display it in a useful way gets me as hard as a diamond.


Add a Comment